
 We respect your privacy. Your information is safe.
Introduction
The Drupal community is dynamic. It’s growing, highly active, and exceptionally colorful. The best part? You can see it.
Recently, I've created a visualization tool for collecting data from drupal.org and spoke about visualizing this data. It’s my hope that these visuals are worth 1,000 constructive words towards our Drupal community and that this will help put our growth and demographics into perspective.
Visualizing The Drupal Community
I have always been fascinated with numbers and specifics. And I’m addicted to collecting data in an organized manner—I don't just mean Excel or religiously using apps like Foursquare and Gnucash to document my day-to-days. I use TripIt to organize and measure my trips, JetLovers to count all my flights.
Basically, I measure everything that can be measured and document it so it can be processed later. Some more background:
I have been a mostly active contributor to Drupal core and ecosystem since 2-3 years ago, and until recently, there was little I could do to quantify it. Those days, we just had commit counts as contributions and I don't think I even had 10 for the longest time.
I considered building something that parses commit messages and then found DrupalCores. Last year in Los Angeles, David Hernandez and I presented a session on encouraging repeat contributions which looked over a lot of data from drupal.org.
At the time, we got the information from the Drupal Association and built our conclusions from there (which are still valid). But I wanted to take it further and analyze the raw data itself. I didn't know about the drupal.org API and didn't want to scrape, obviously.
All of this changed earlier this year when Azri setup a contest to visualize data on drupal.org for DrupalCon Asia and pointed me to the API. I basically wrote something that mirrors the data I wanted to focus on and I could process it later however I wanted. As expected, it took a lot of time to get all the users. But despite my fears, I won the competition.

Some great tools I used
Because this is Open Source and I'm hoping everyone gets involved with this in spirit and in pull requests. My visualizer is built with Laravel 5.2, it needs PHP 5.5 (runs on PHP 7 right now), MongoDB 3.2, and beanstalk. Most of the data crunching is done by MongoDB's aggregation pipeline, with little massaging of the data on the PHP or JS side. The graphs are built directly with d3.js.
I'm looking into using a reusable charting library based on d3.js but I haven't settled on one yet. If you have any, tweet me your suggestions.
It's about asking the right questions:
Data collection is an important part of data science but a relatively simple one. What is much more important is asking the right question. All the data in the world are just numbers until someone asks the right question to transform it into meaningful information. Here's what happens when you transform Drupal community data:
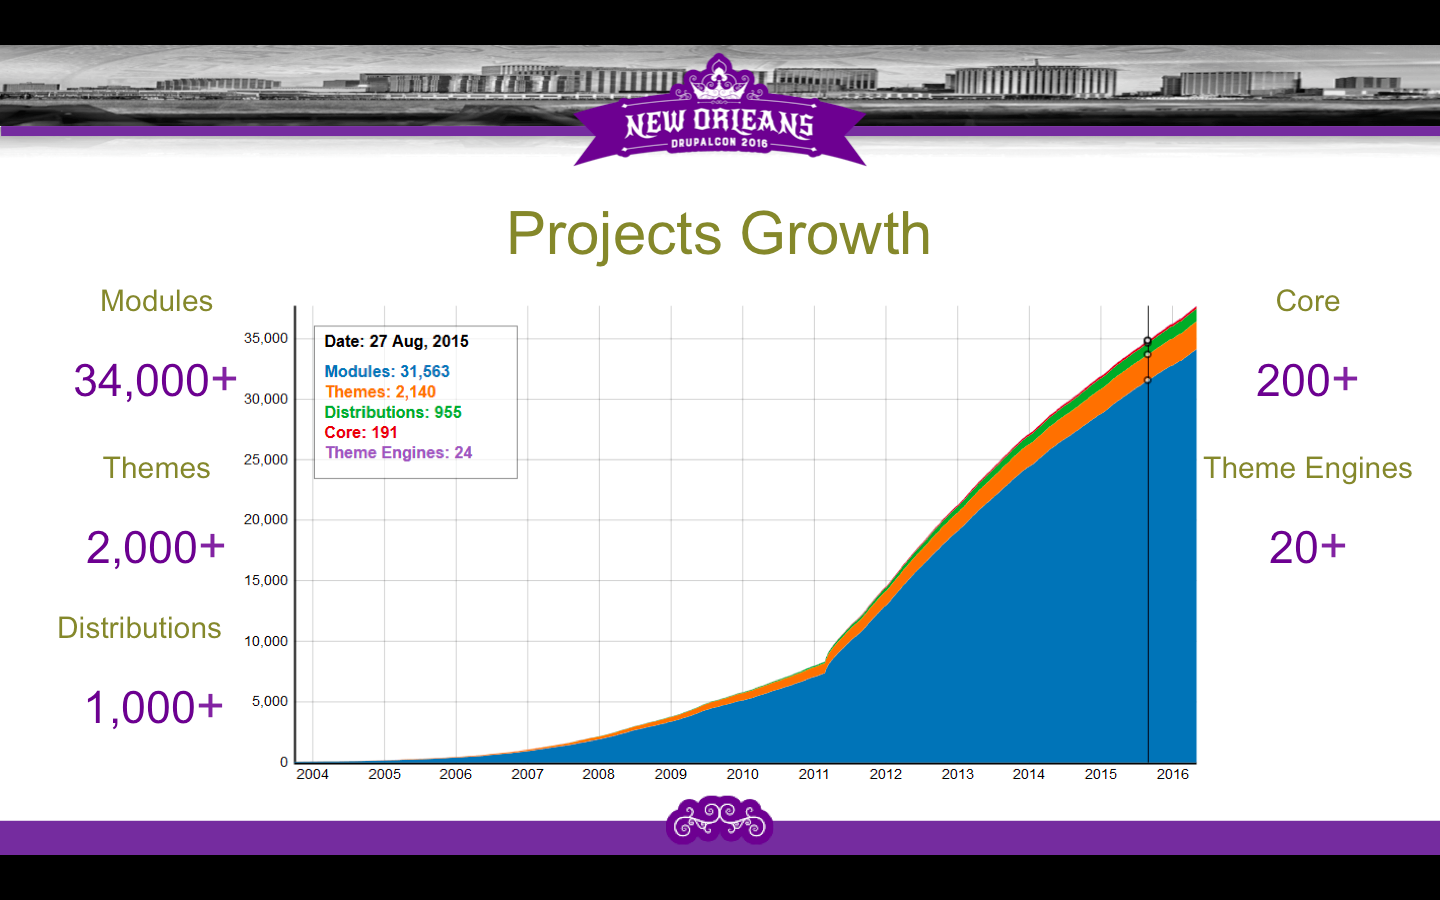
Projects Growth
Projects are an important point of the community and it is useful to know how they are growing. This chart shows the growth of all the projects on drupal.org since the beginning. You can barely see the theme engines and core projects here. Understandably, the difference is huge: 34,000 modules against a few theme engines.
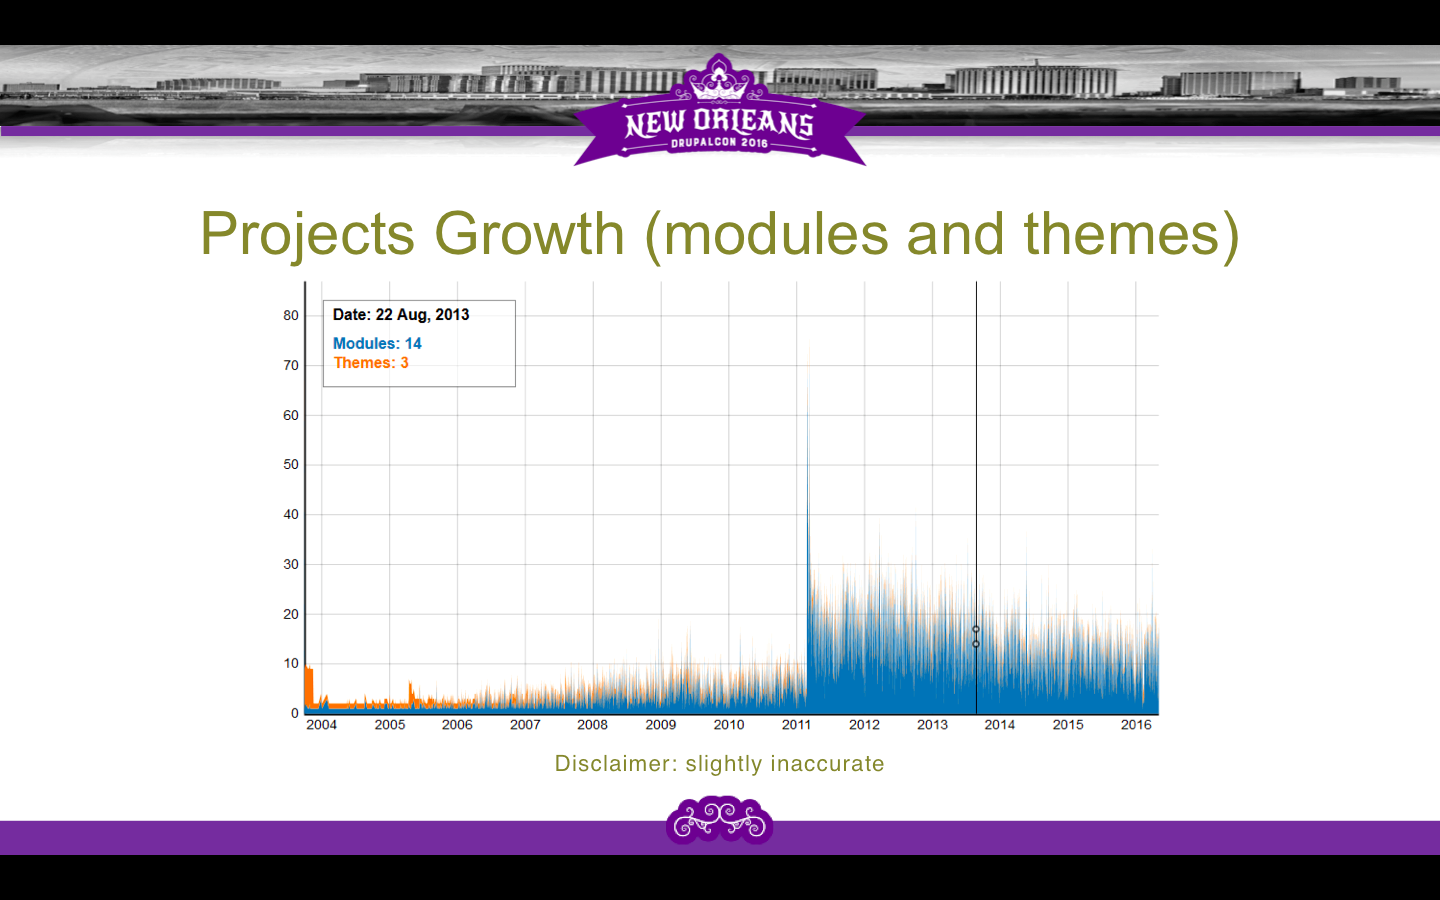
Projects Growth (Modules & Themes)
This graph shows the changes a little bit more clearly. There is a sudden jump in the number of projects in the first quarter of 2011. I'm not sure what caused this but a jump of 80-100 projects should be easily explained. It could be a bunch of projects being created for Drupal 8 development start (which happened around that time). This is slightly inaccurate around the jumps you can't see here. Basically, a line graph is not the proper way to show these changes, it should be a bar chart, and the jumps are over the days don't have any new projects at all.
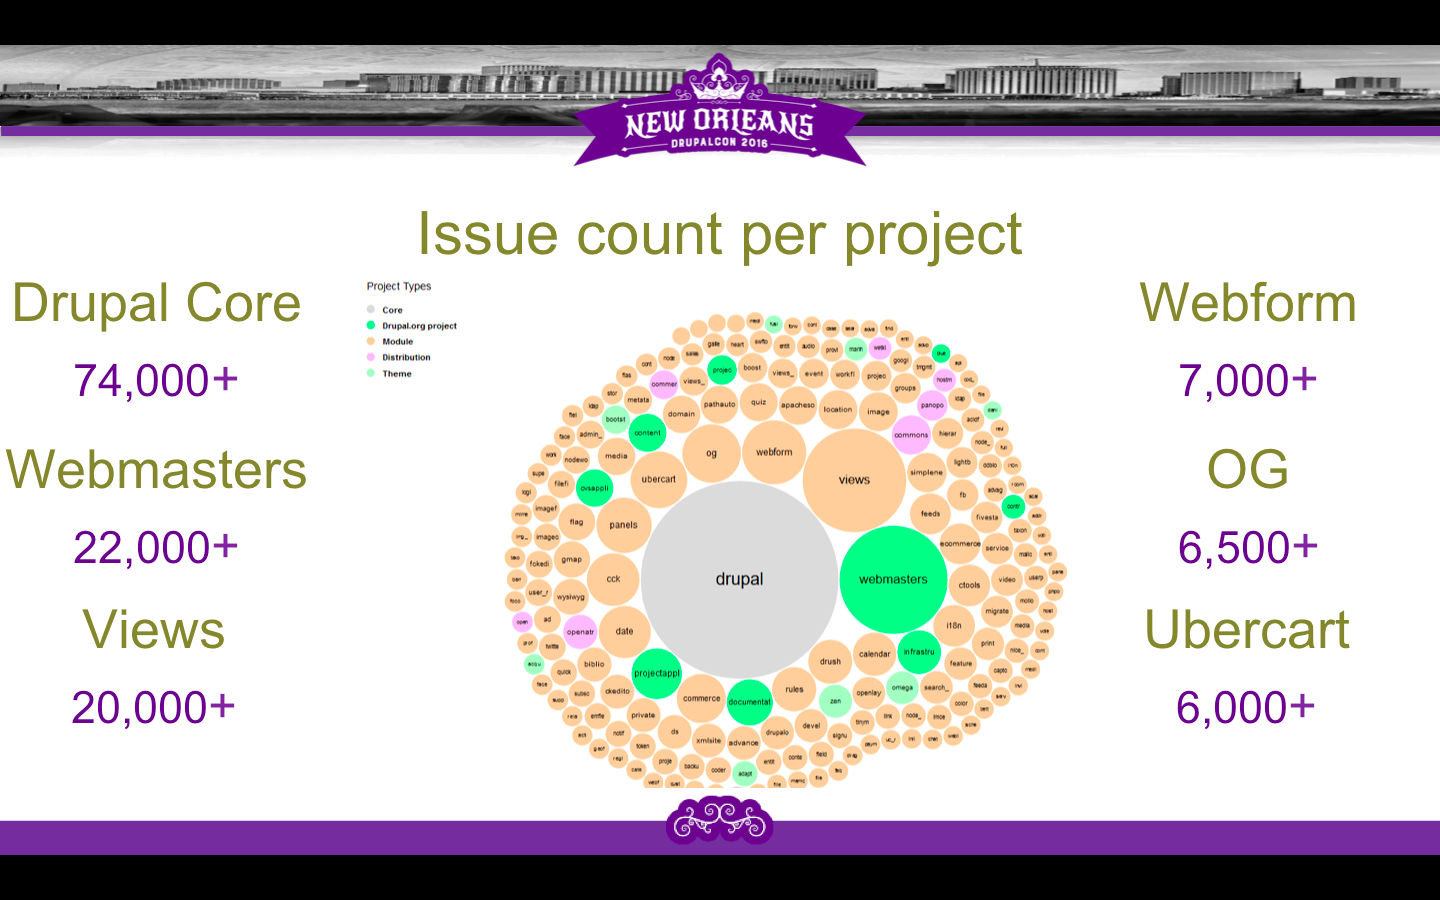
Issue Count Per Project
Another way to look at the project is the number of issues. This chart shows all the projects sorted by just that. This is a way to see most active projects on drupal.org. While it could be an indication of code quality, I think it is more about how active the Drupal community is on drupal.org and how often that module just works out of the box.
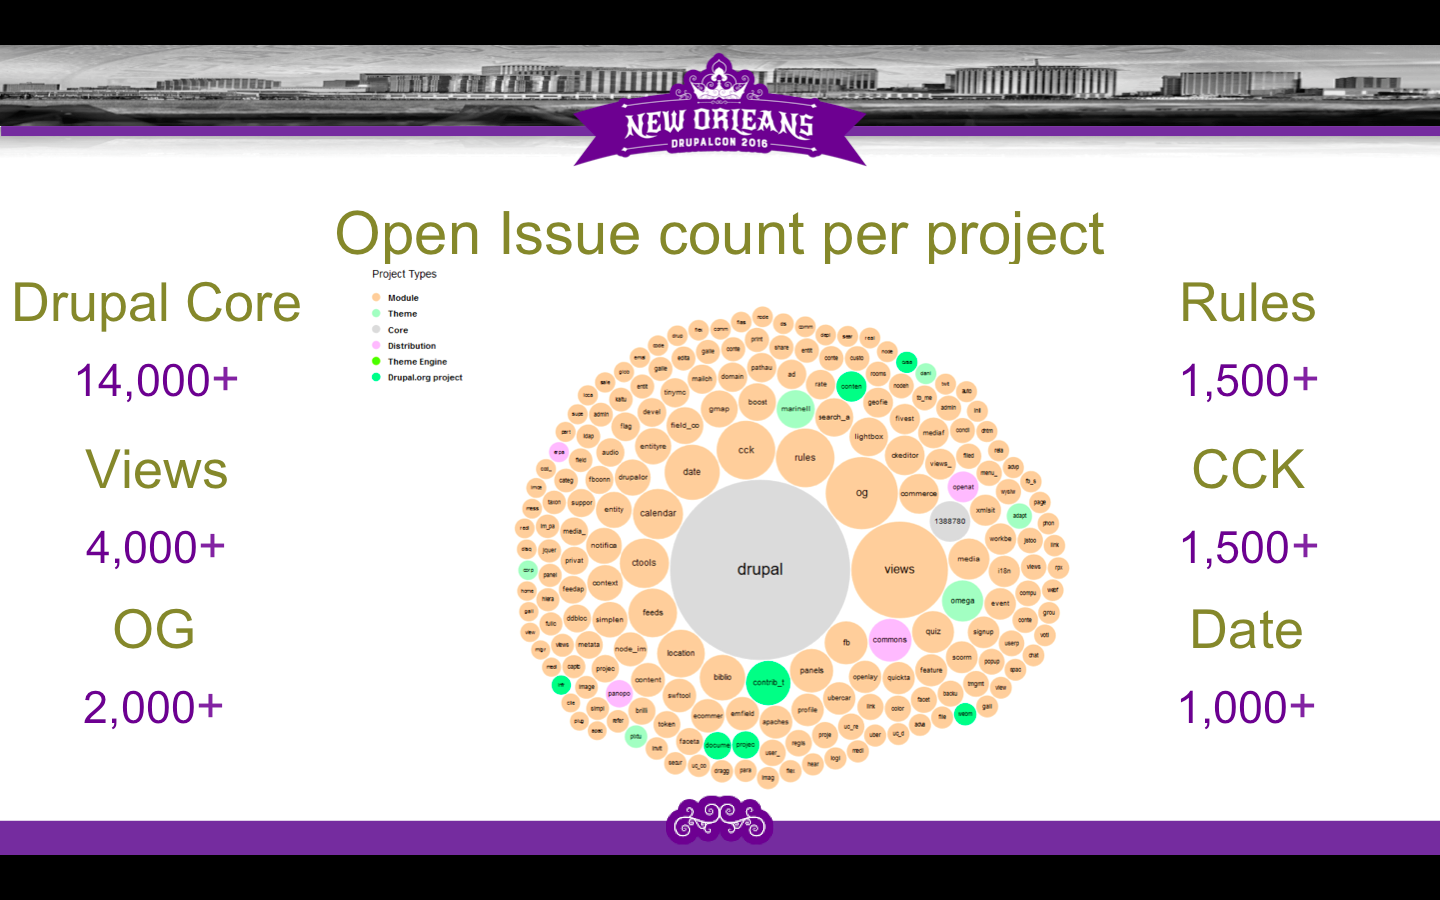
Open Issue Count Per Project
A slightly different way to look at this would be to just see the number of open issues. This is a stronger indicator of the quality, response time, and the overall health of that project. If a project doesn't show up here, it could also mean that it is not used by enough people.
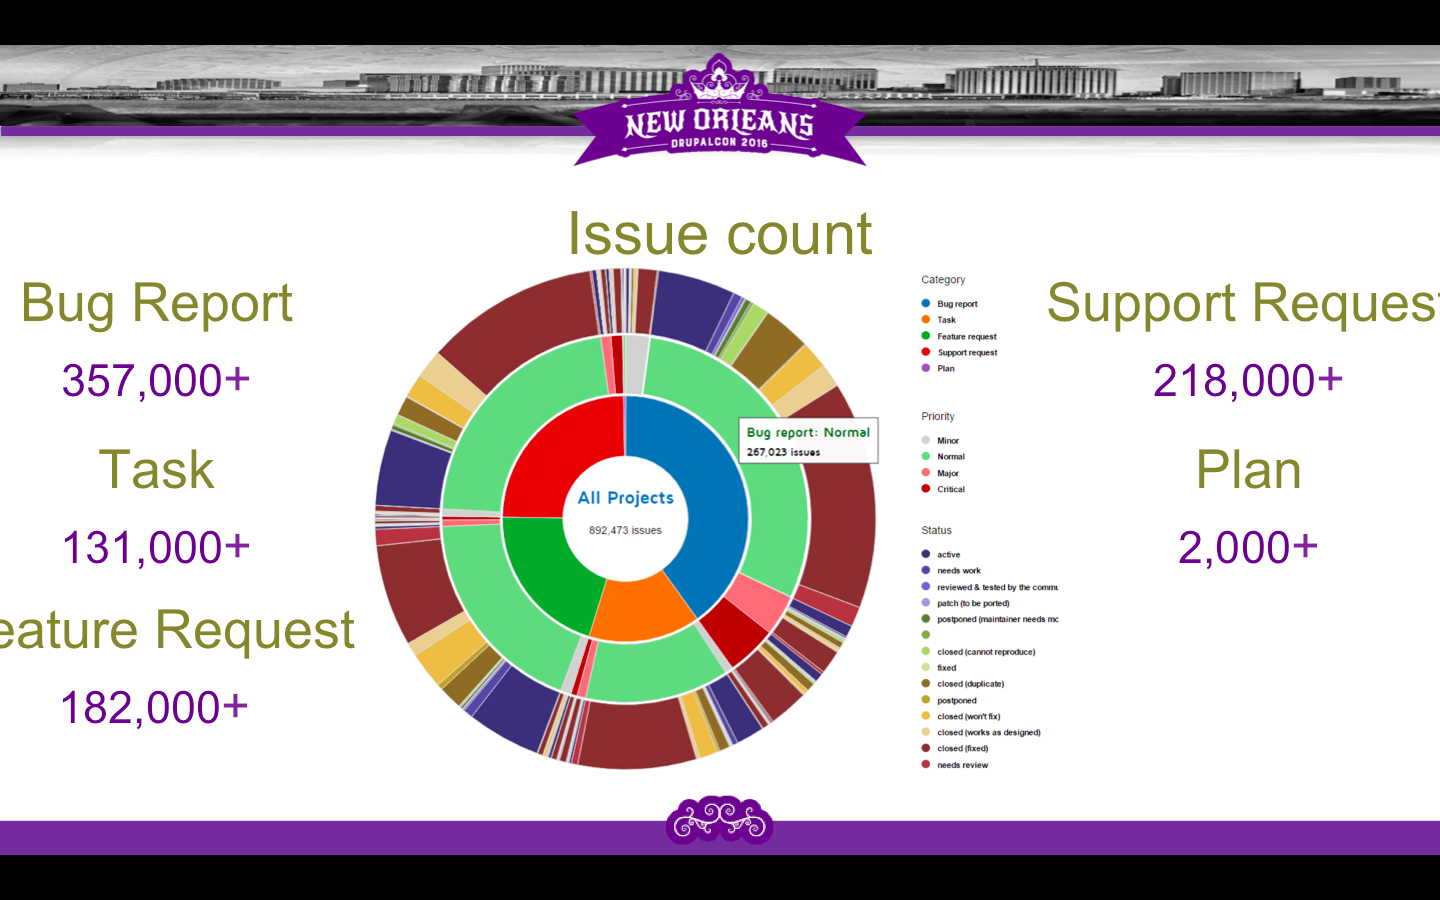
Issue Count
Or we could just look at the overall issue count on drupal.org. We can see that most issues are bug reports followed by support requests. We then have about the same number of feature requests and tasks but very few plans comparatively. I understand it is a new issue type and you would not have too many plans compared to features anyway.
As we saw from the previous bubble chart, we see that most of these issues are closed, as you can see from the large maroon pie slices in the outer donut. There are other types of closed issues (like won't fix and works as designed) which turns out to about 75% of overall issues closed on an average. This matches the numbers we saw in the previous bubble chart.
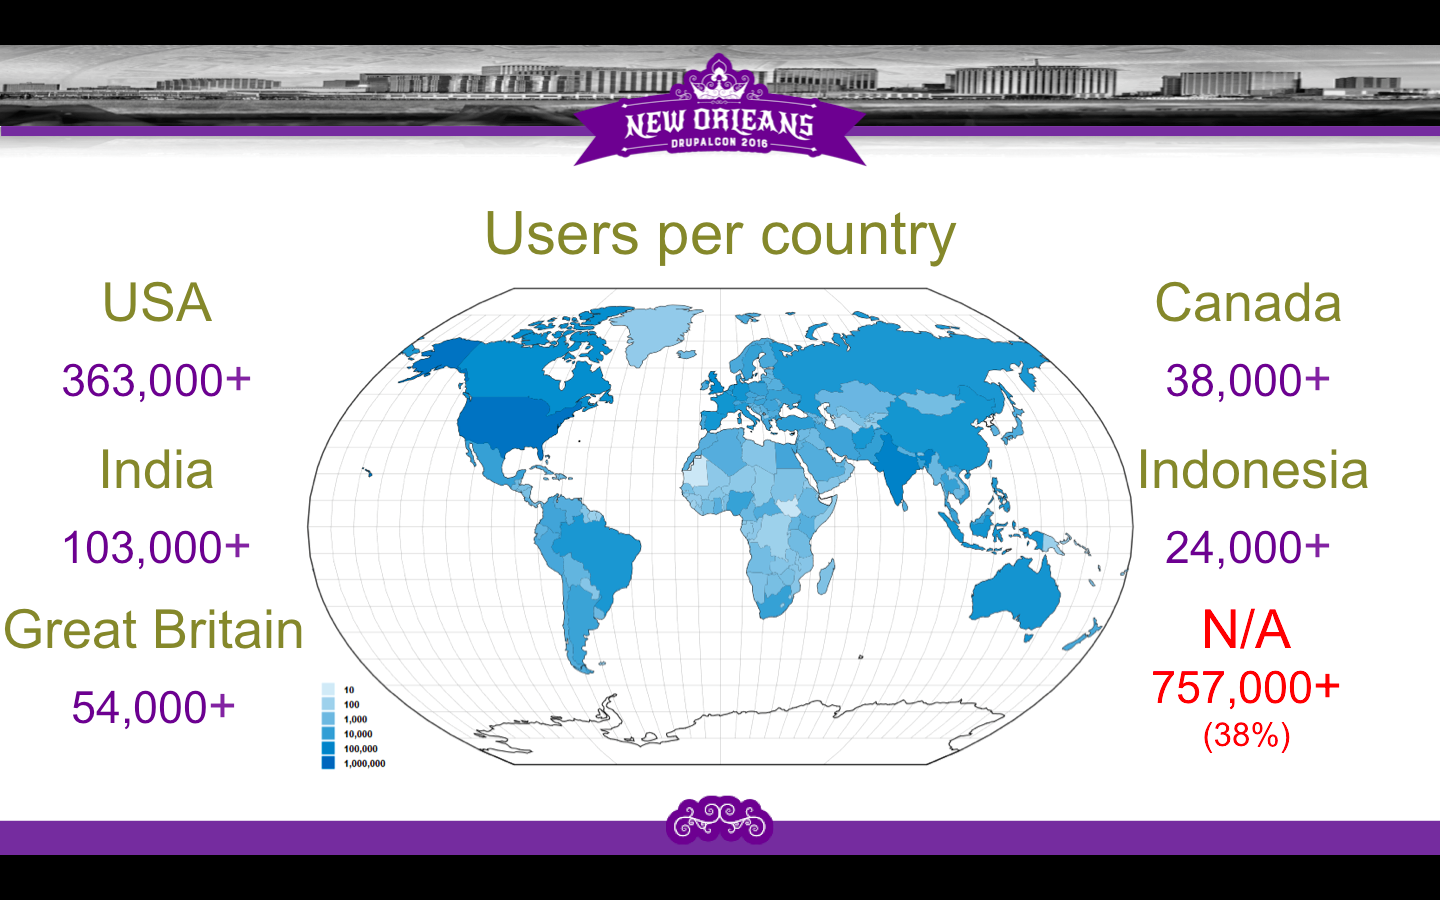
Users Per Country
Of course, users are the Drupal community, and drupal.org has over 1.9M users. The USA has roughly 3.5 times the number of users in India, which has about twice as the number of users from the United Kingdom, three times that of Canada, and four times that of Indonesia. A sizable 38% of users do not have the country specified at all. We'll come back to talking about countries.
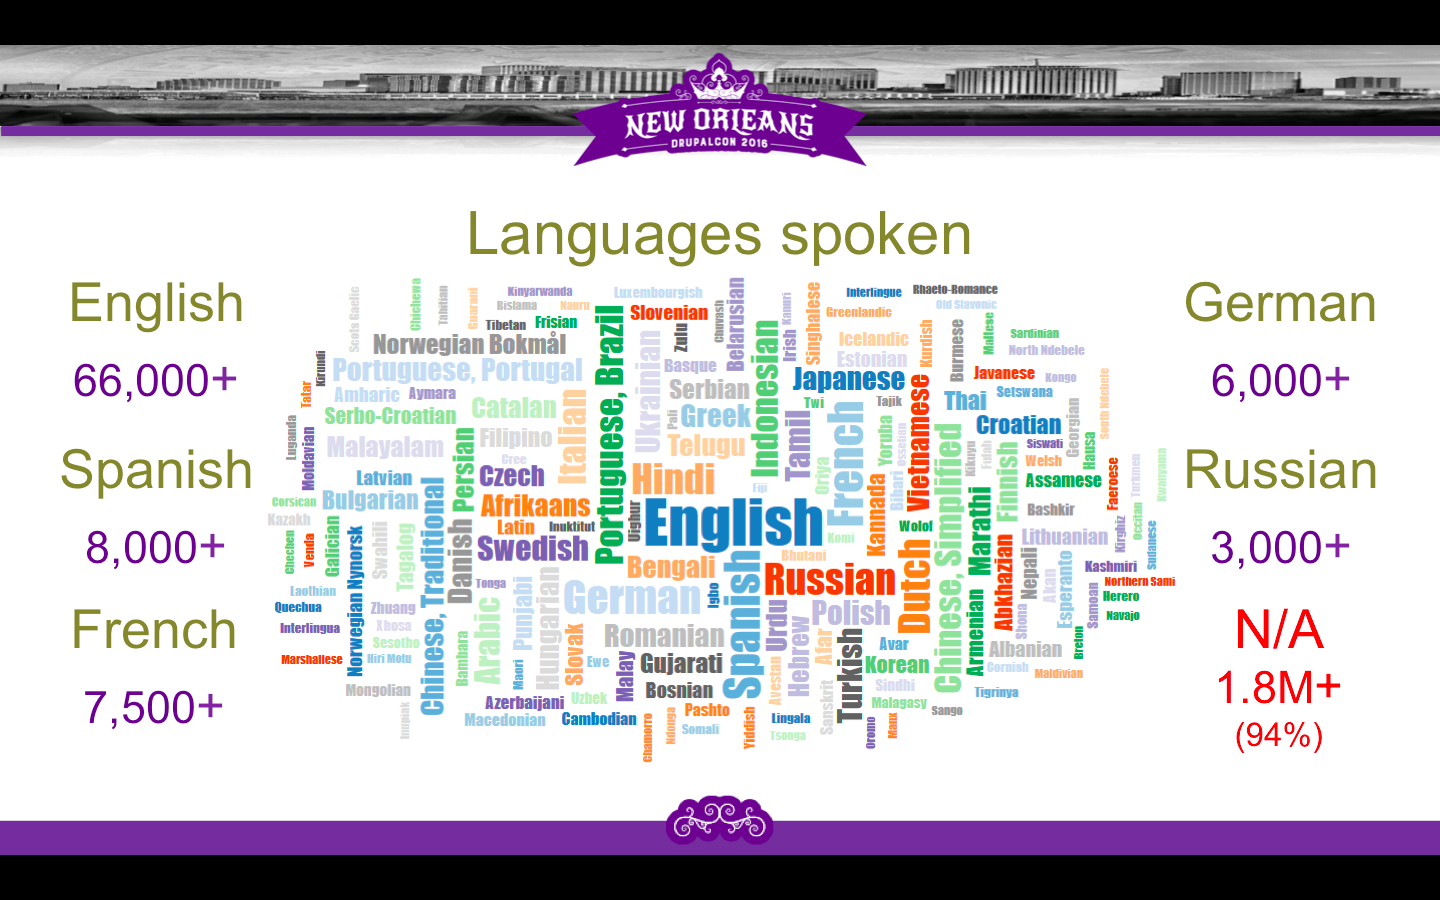
Languages Spoken By Drupalers
About 66,000 users on drupal.org say they speak English, followed by 8,000 who speak Spanish.
Expertise
Similarly, roughly 3,000 people call themselves developer and a similar number calls themselves site builder. However, most of the users on drupal.org have not filled this information. Therefore, the sample size too small to obtain information reliably. But it does help satisfy our curiosity.

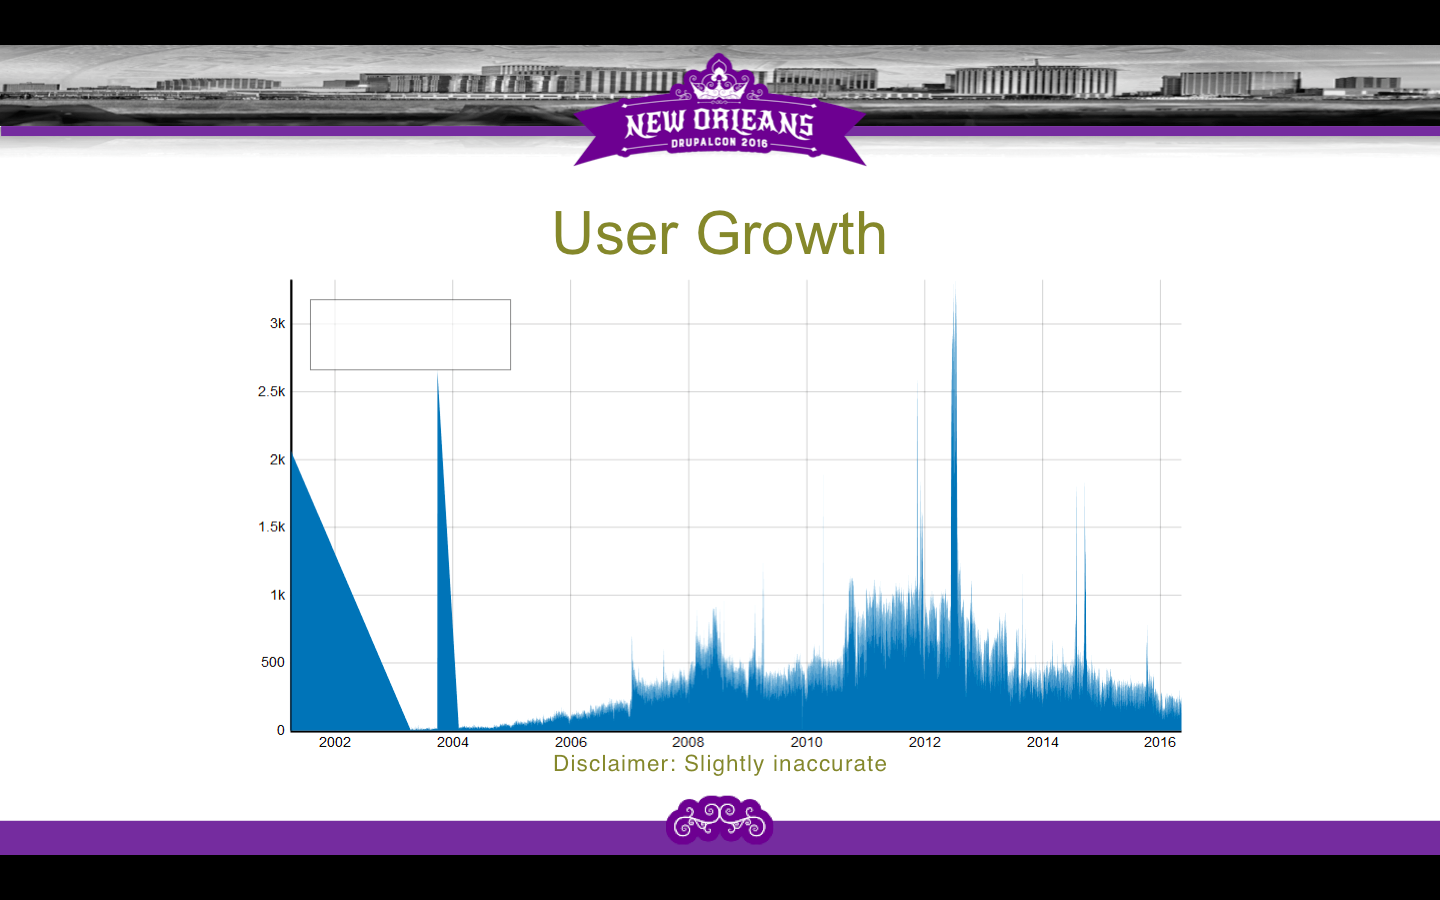
User Growth
This is how the growth of users on drupal.org has looked like these past few years. Assuming that user id's are assigned sequentially, and latest `uid` being 3.5M, we can guess that roughly 1.5M users have been blocked or removed from the site. Still, we see some small jumps in the data here which should get emphasized in the next chart.
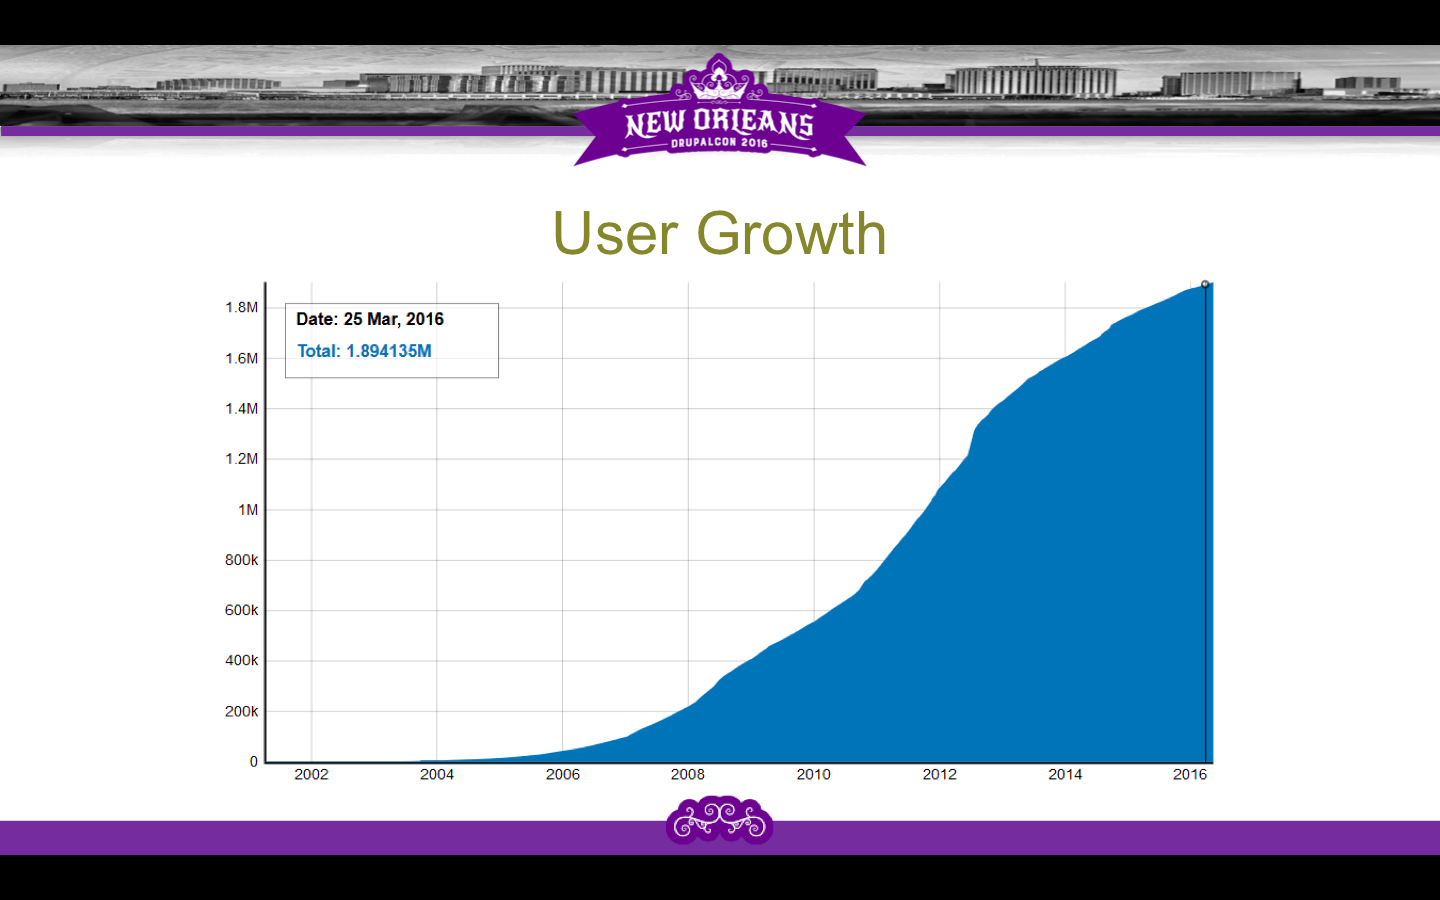
Again, ignore the large slopes in the beginning. It is likely a result of some migration when roughly 2,000 users were created on that day and then none for a while. However, the peaks later are accurate, with a peak around mid-2002 when about 3,000 users were created. You could see this in a sudden climb in the previous graph.
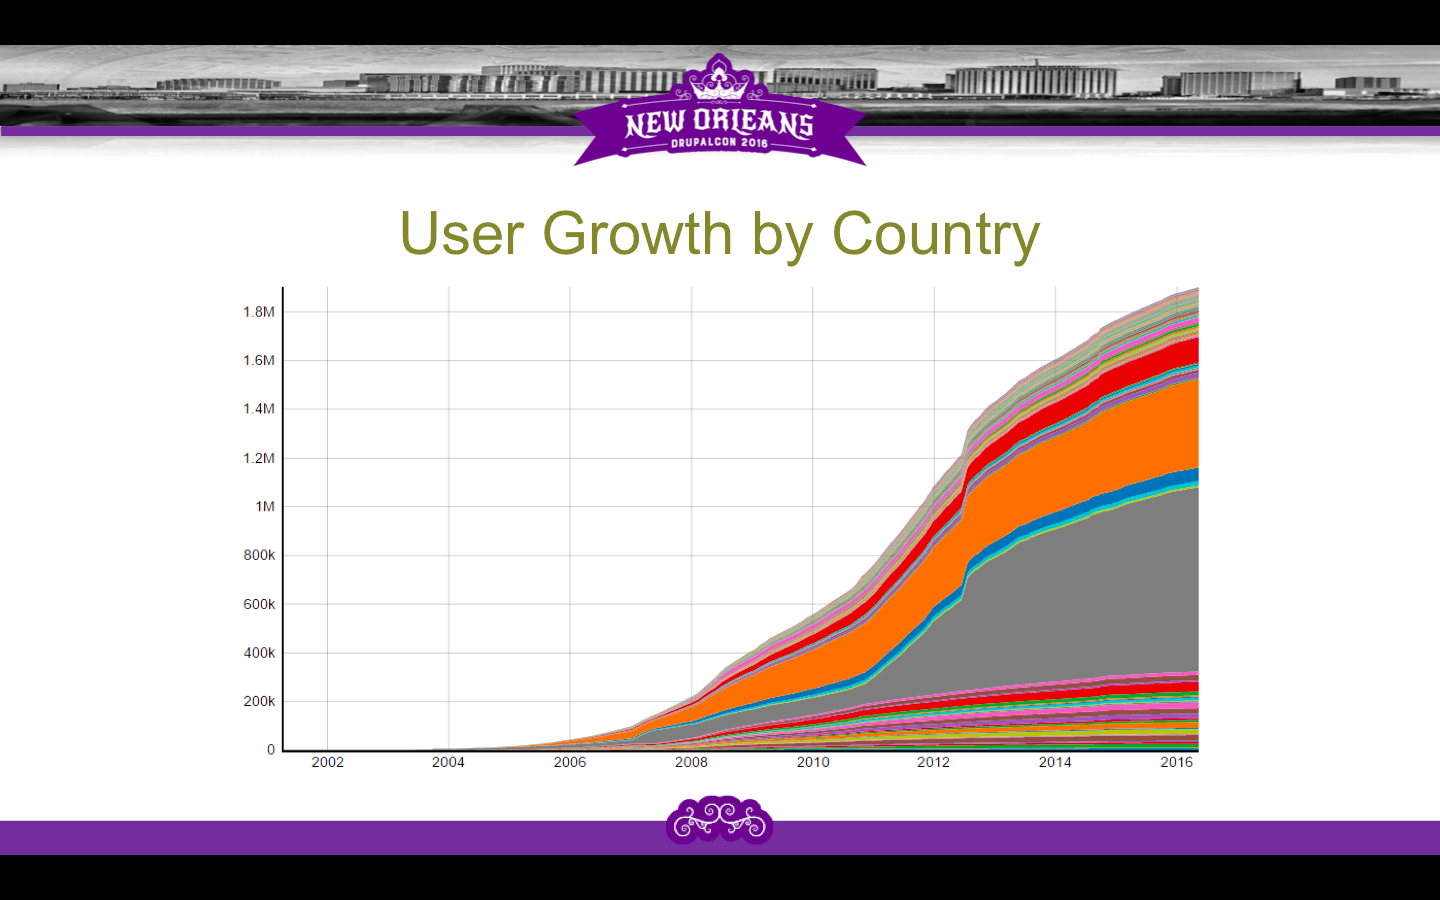
User Growth By Country
This was a complicated chart to create, because of the number of countries. Firefox always crashed and Chrome rendered it but stopped the animation. Anyway, the biggest gray chunk you see in this graph is where a country is not specified. The climb we saw around 2002 are almost all from this chunk. It is quite likely most of these are spam. The next orange chunk is the United States, followed by the red of India. These are the fastest growing countries as you can see from their relative sizes, but all countries are growing linearly—the Drupal community is growing globally.
Drustats.com is currently under construction, but I'd appreciate feedback and contributions. Just create issues or pull requests there if you'd like. I am also planning to integrate to Twitter soon but for now, the handle is dru_stats.

Hussain Abbas, Director of Developer Experience Services
Hussain is a calm ambivert who'll surprise you with his sense of humor (and sublime cooking skills). Our resident sci-fi and fantasy fanatic.


Leave us a comment