 We respect your privacy. Your information is safe.
When a CIO can't tell which department consumed which service, every dollar lands on IT. The fix isn't another FinOps tool. It's a data engineering pipeline that normalizes fragmented billing data into structured financial intelligence.
The $5 Million Spend Nobody Owns
If you're a CIO or VP of Engineering at an enterprise technology organization, you've almost certainly seen this pattern. The IT budget looks bloated. Service contracts pile up. Three to five million dollars in annual SaaS, observability, and infrastructure spend lands in your column, even though half of it is consumed by engineering teams, a chunk by ops, and a long tail by departments you didn't know used the tool. When finance asks why IT spend grew, you don't have an answer that breaks down by team. The whole thing defaults to IT because that's where the procurement card lives.
That's not a budgeting problem. That's a data problem. And the reason it stays unsolved in most enterprises isn't ambition or budget. It's that no one in the org has the time to build the boring layer underneath the dashboards.
What We Ran Into
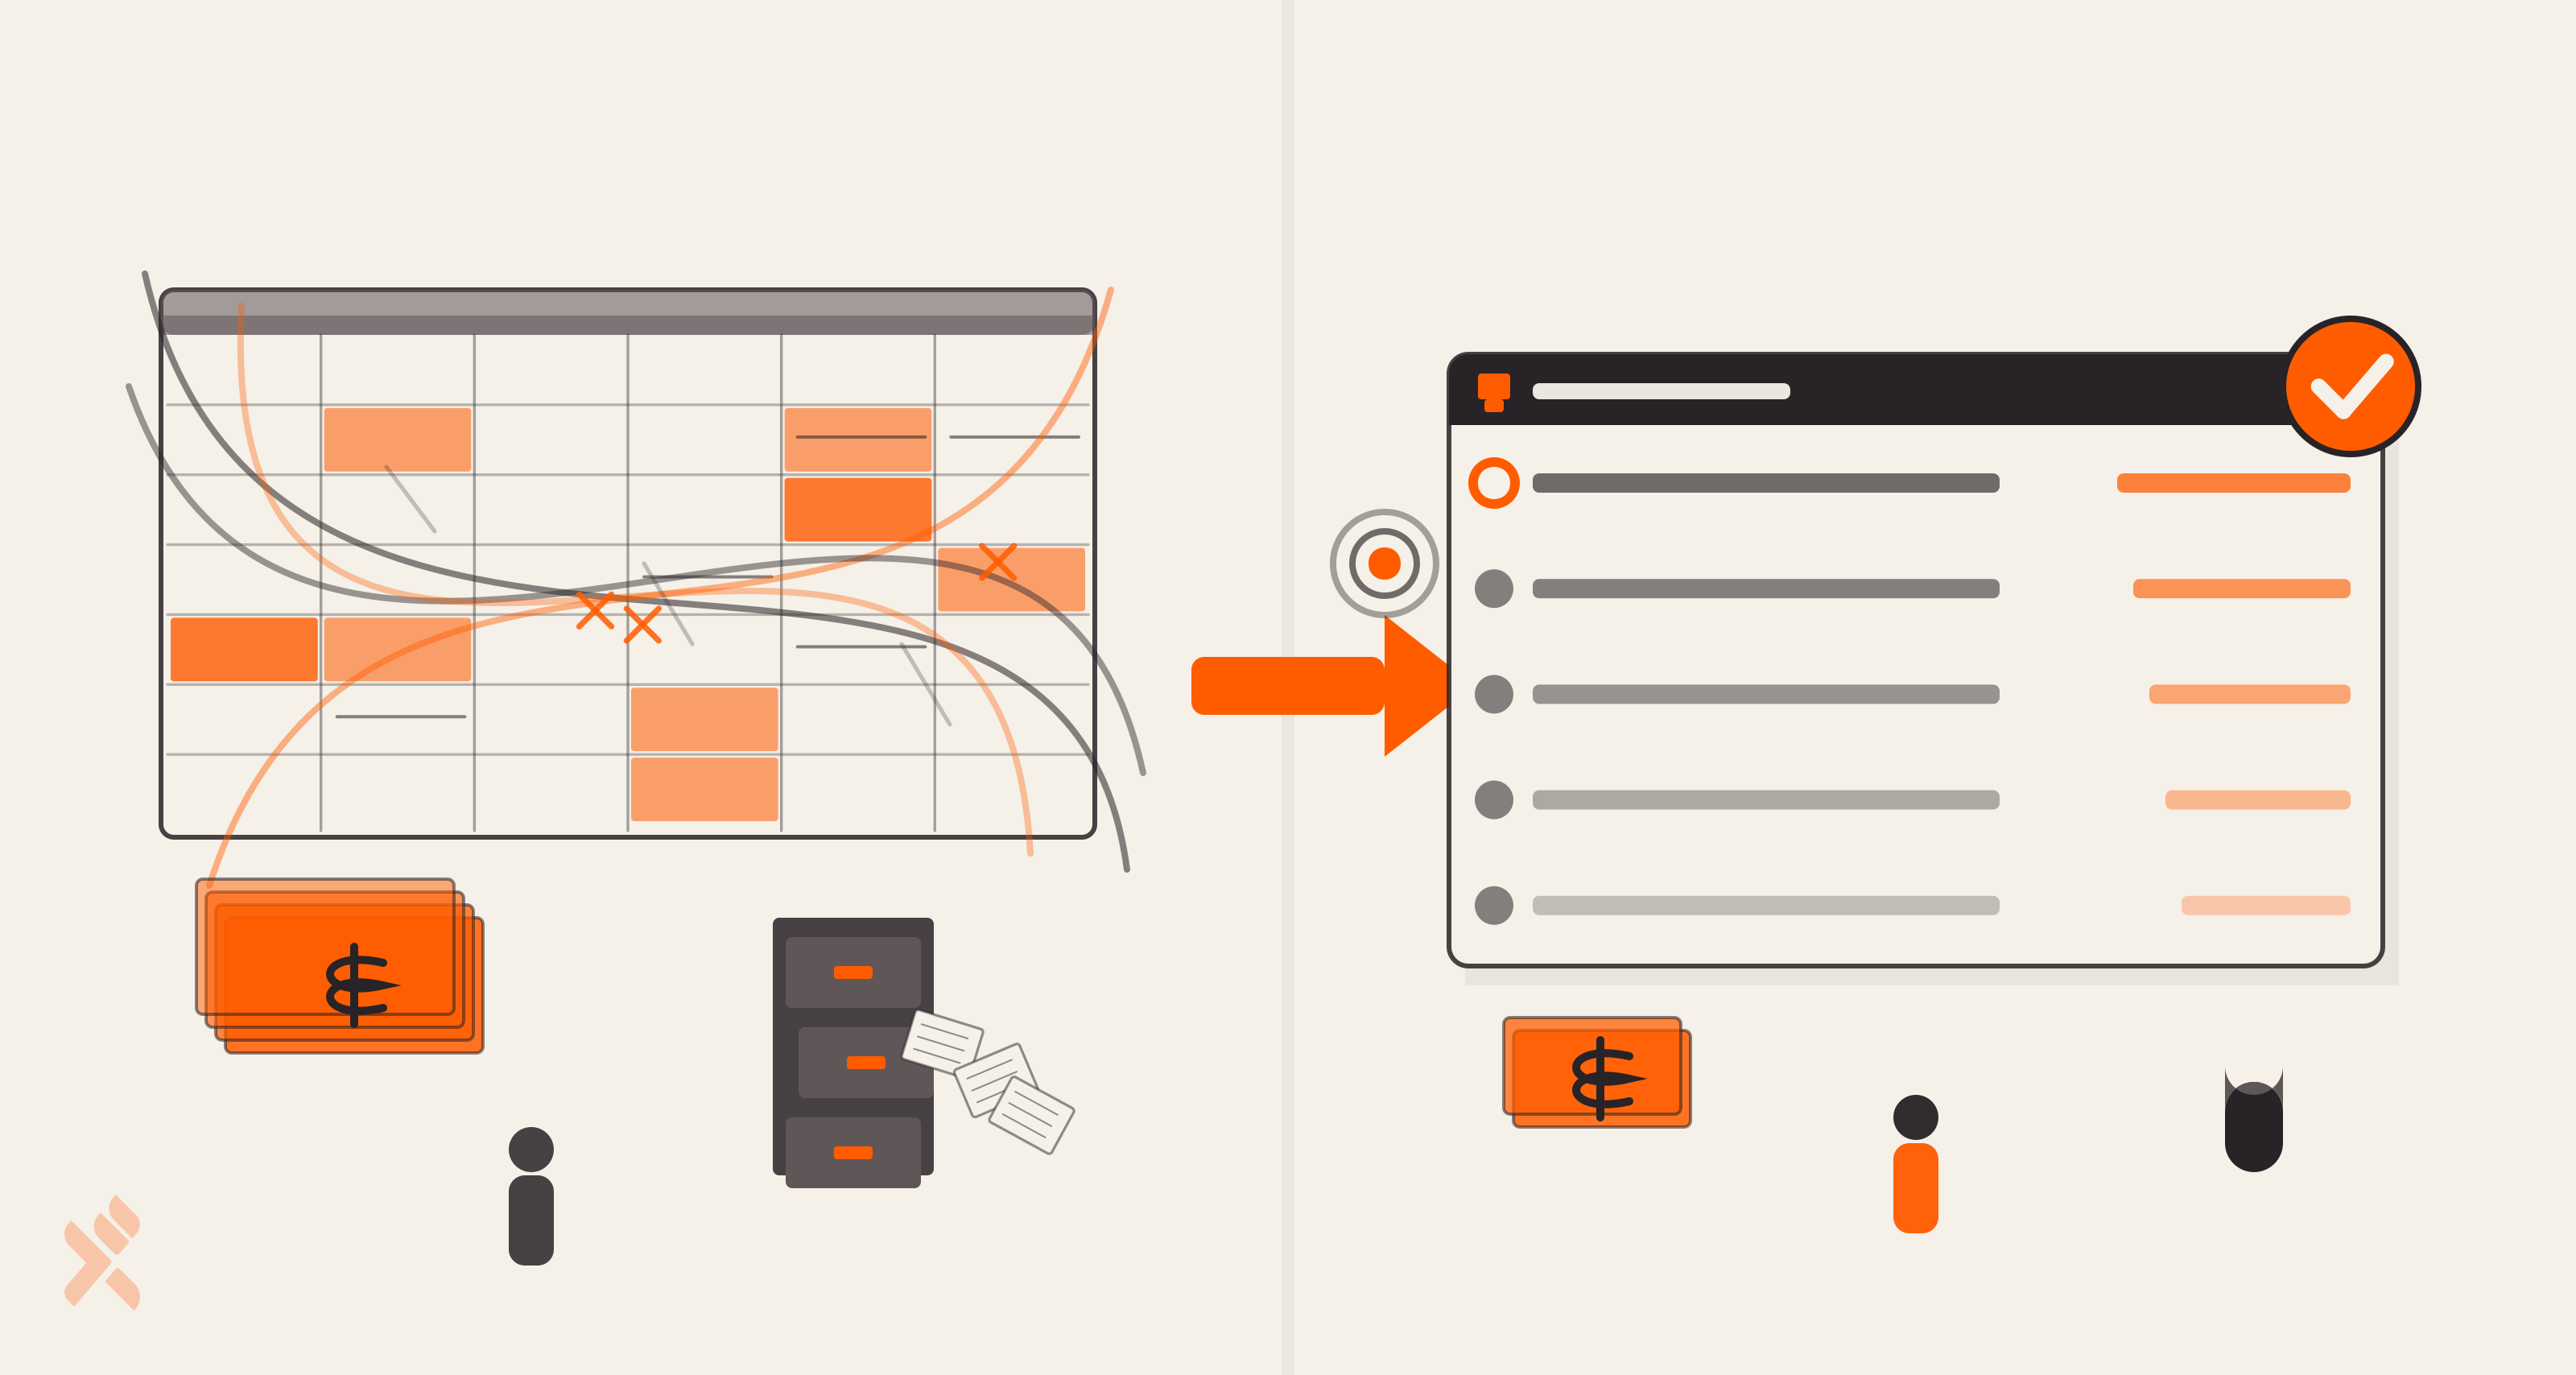
We worked on this with an engineering organization that had over twenty infrastructure and observability platforms across its stack. The usual surface area: incident response, log aggregation, application performance monitoring, cloud infrastructure, container management, and AI tooling. Each platform charged differently. Some were event-based. Some were license-allocated. Some ran on prepaid credit pools. Some had hybrid models that changed mid-quarter when a contract was renegotiated.
The cost tracking system in place was a spreadsheet. One engineer pulled exports from each vendor, ran transformations in Excel, and emailed the result to finance once a month. When the company added a service, the spreadsheet expanded. When a vendor changed its export format, the spreadsheet broke. When someone made a rounding error in column F, it propagated through every downstream report. By the time leadership saw the numbers, they were stale and trusted by no one.
The deeper problem was structural. The vendor data didn't speak the same language. A license-based tool reported seat counts. An event-based tool reported API calls. A credit-based platform reported consumption units. No schema would let you compare them, no way to ask "which department drove the most spend last month," because that question required normalizing five different billing models before you could even start.
What We Did, And Why
We treated this as a data engineering problem rather than a FinOps tooling problem. The temptation in this space is to buy a vendor platform that promises to do all of this out of the box. We've watched those deployments stall, because every enterprise's billing data is just messy enough that off-the-shelf normalization fails on the long tail. You end up running a vendor tool plus a spreadsheet to fix what the vendor tool got wrong.
Instead, we built an AWS-native pipeline. Daily extraction from 15 to 20 platforms. Cleaning and normalization in Python. Storage in S3 with lifecycle policies to manage cost. Querying through AWS Athena. Operational monitoring through CloudWatch. The full daily run completes in 30 to 45 minutes, which keeps insights current to the last working day.
The architecture choice was deliberate. AWS-native gave us cheap storage, serverless querying, and observability that the platform team already operated. We didn't want to introduce a new operational surface for a financial visibility platform. We wanted the platform to run inside the boundary that the team already monitored.
The harder part was the transformation logic. Each of the twenty services needed its own custom ingest path. There's no shortcut here. If your event-based platform exports usage in fifteen-minute buckets and your license-based platform exports a quarterly allocation, you have to write the code that resolves both into a consistent department-level monthly view. We treated each integration as a small ETL project, scoped it independently, and added it to the pipeline one at a time.
The most important technical decision was the validation framework. Financial reporting demands decimal-level precision. A rounding error that produces an extra fifty cents in the wrong department report is the kind of thing that destroys leadership trust in a dashboard. We built a multi-stage validation process that cross-checks every transformation stage against the vendor's native dashboards and source interfaces. Issues that used to appear monthly now appear rarely. The dashboards became something the CEO is willing to look at. (We've written separately about what governance actually looks like when systems run themselves, and a lot of the same principles apply when a CEO is reading a number generated by a pipeline she has never seen.)
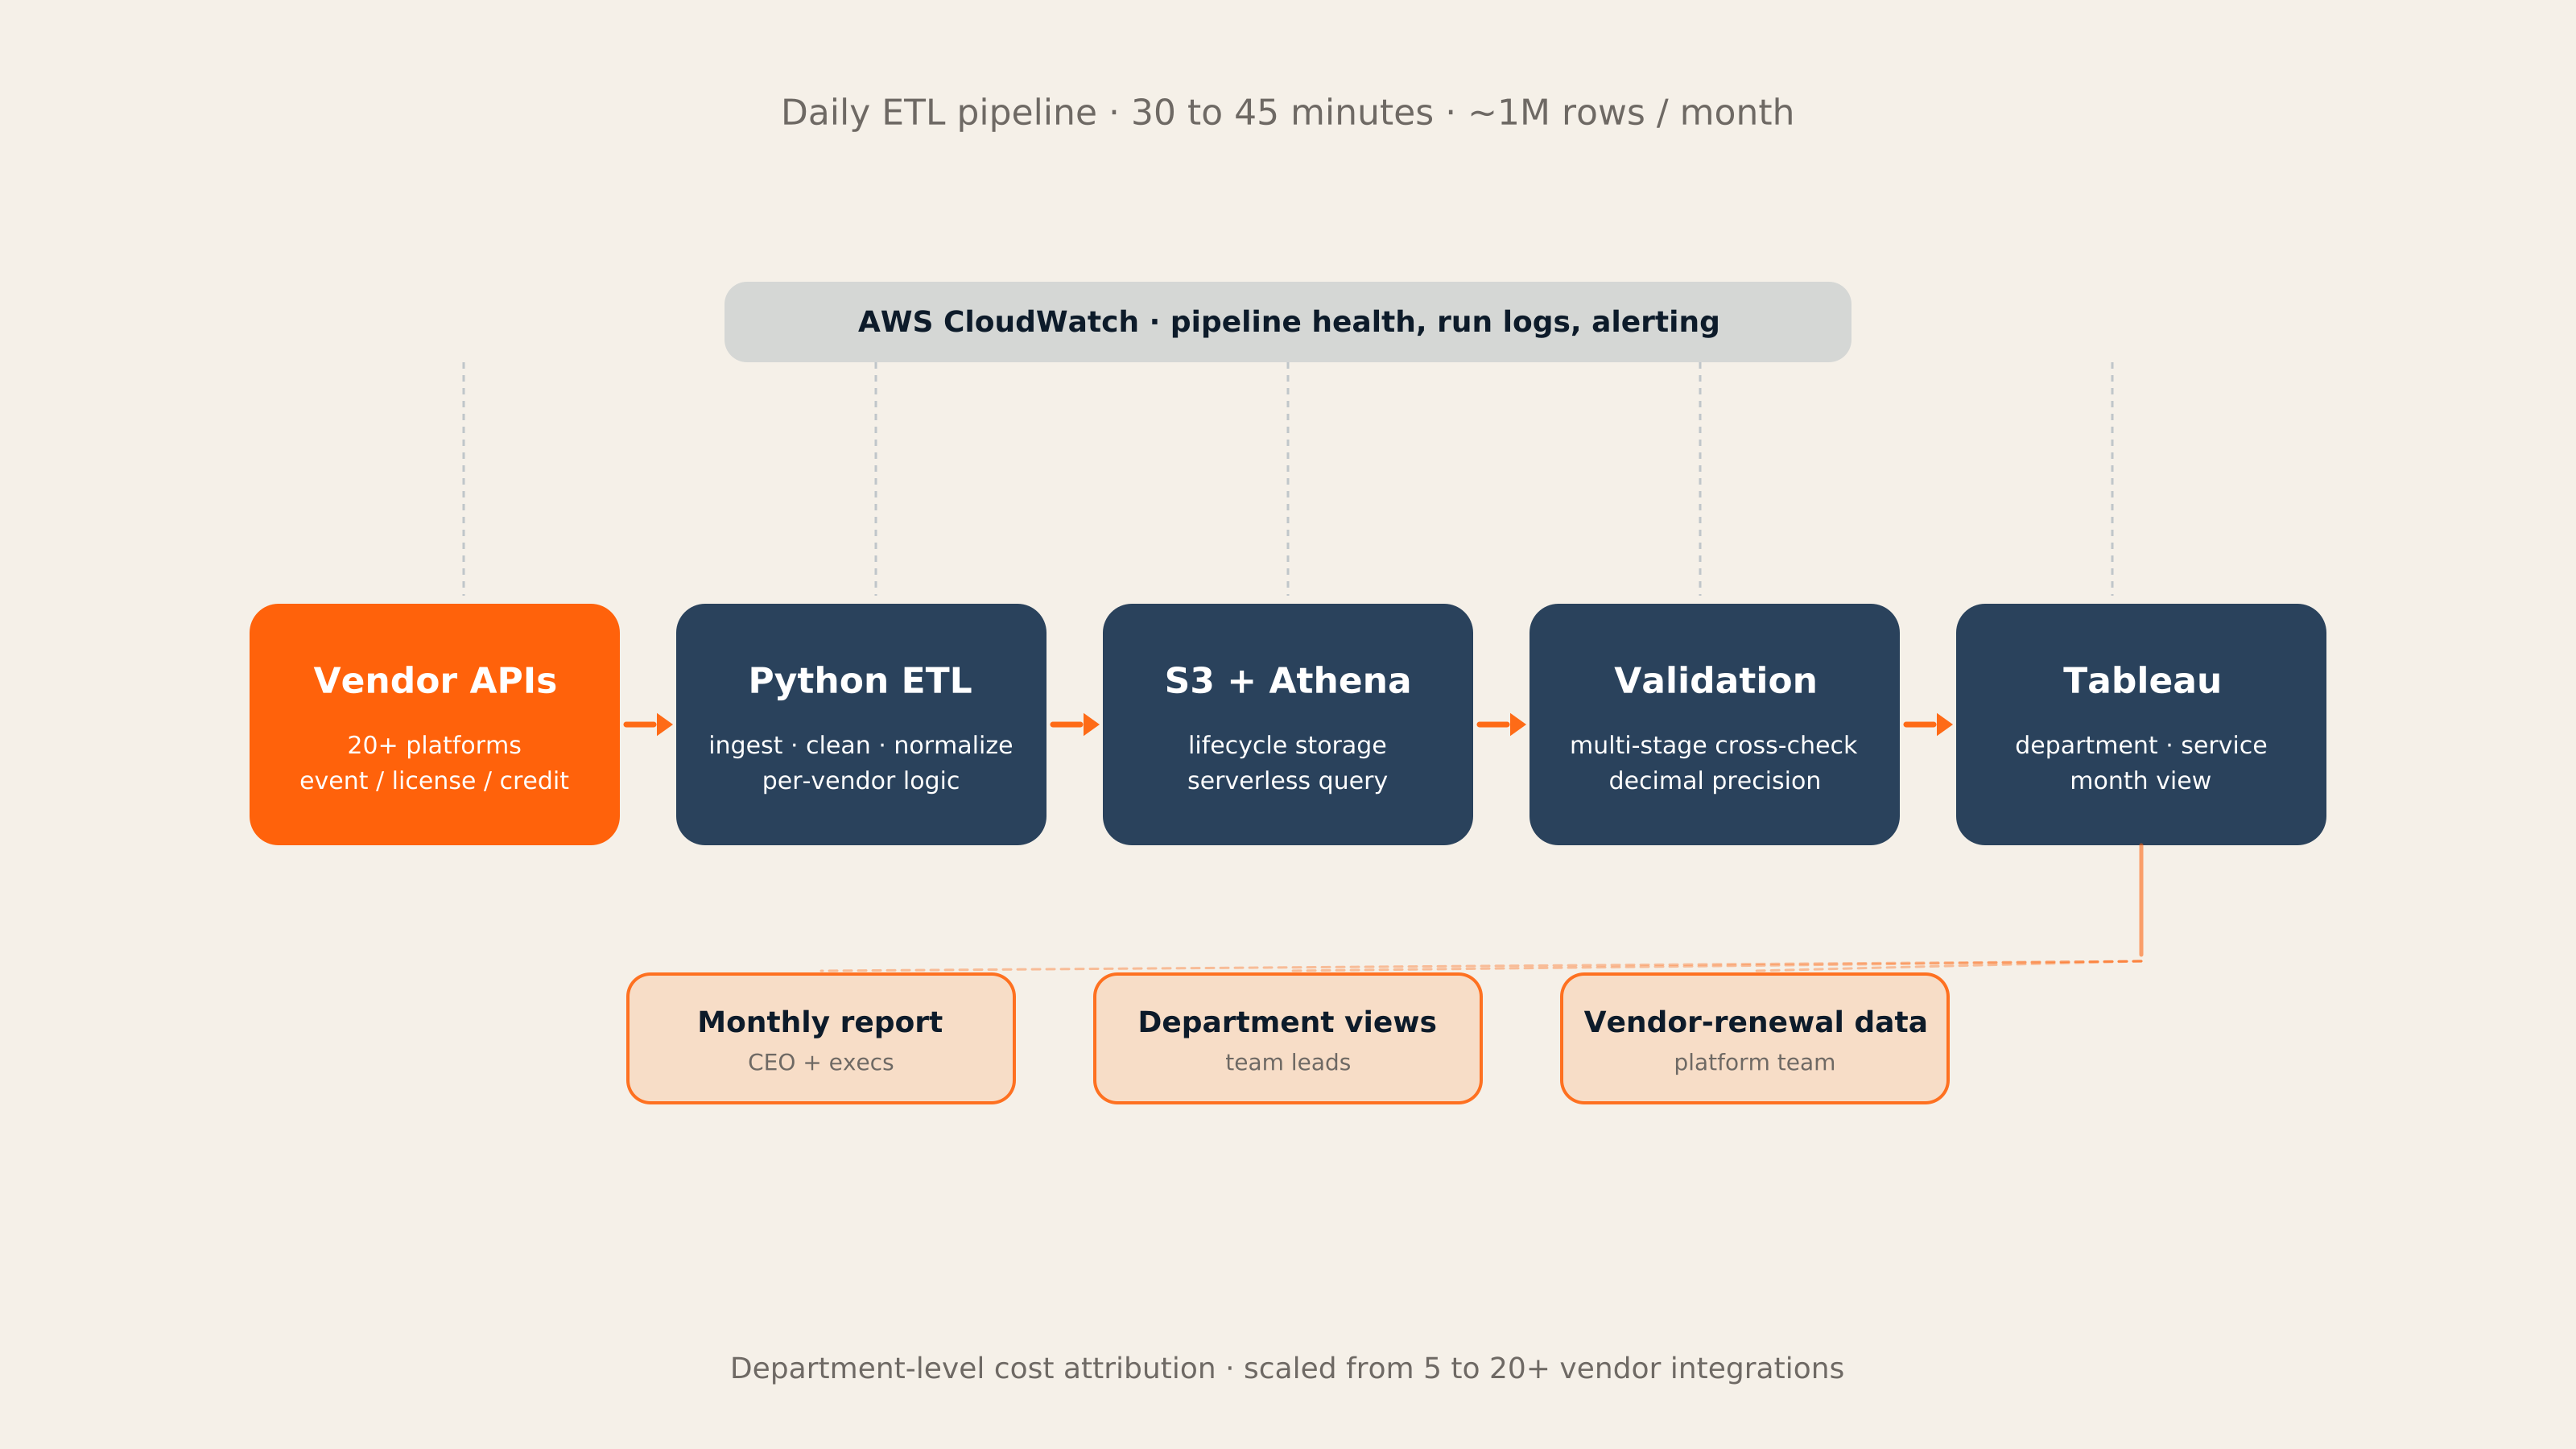
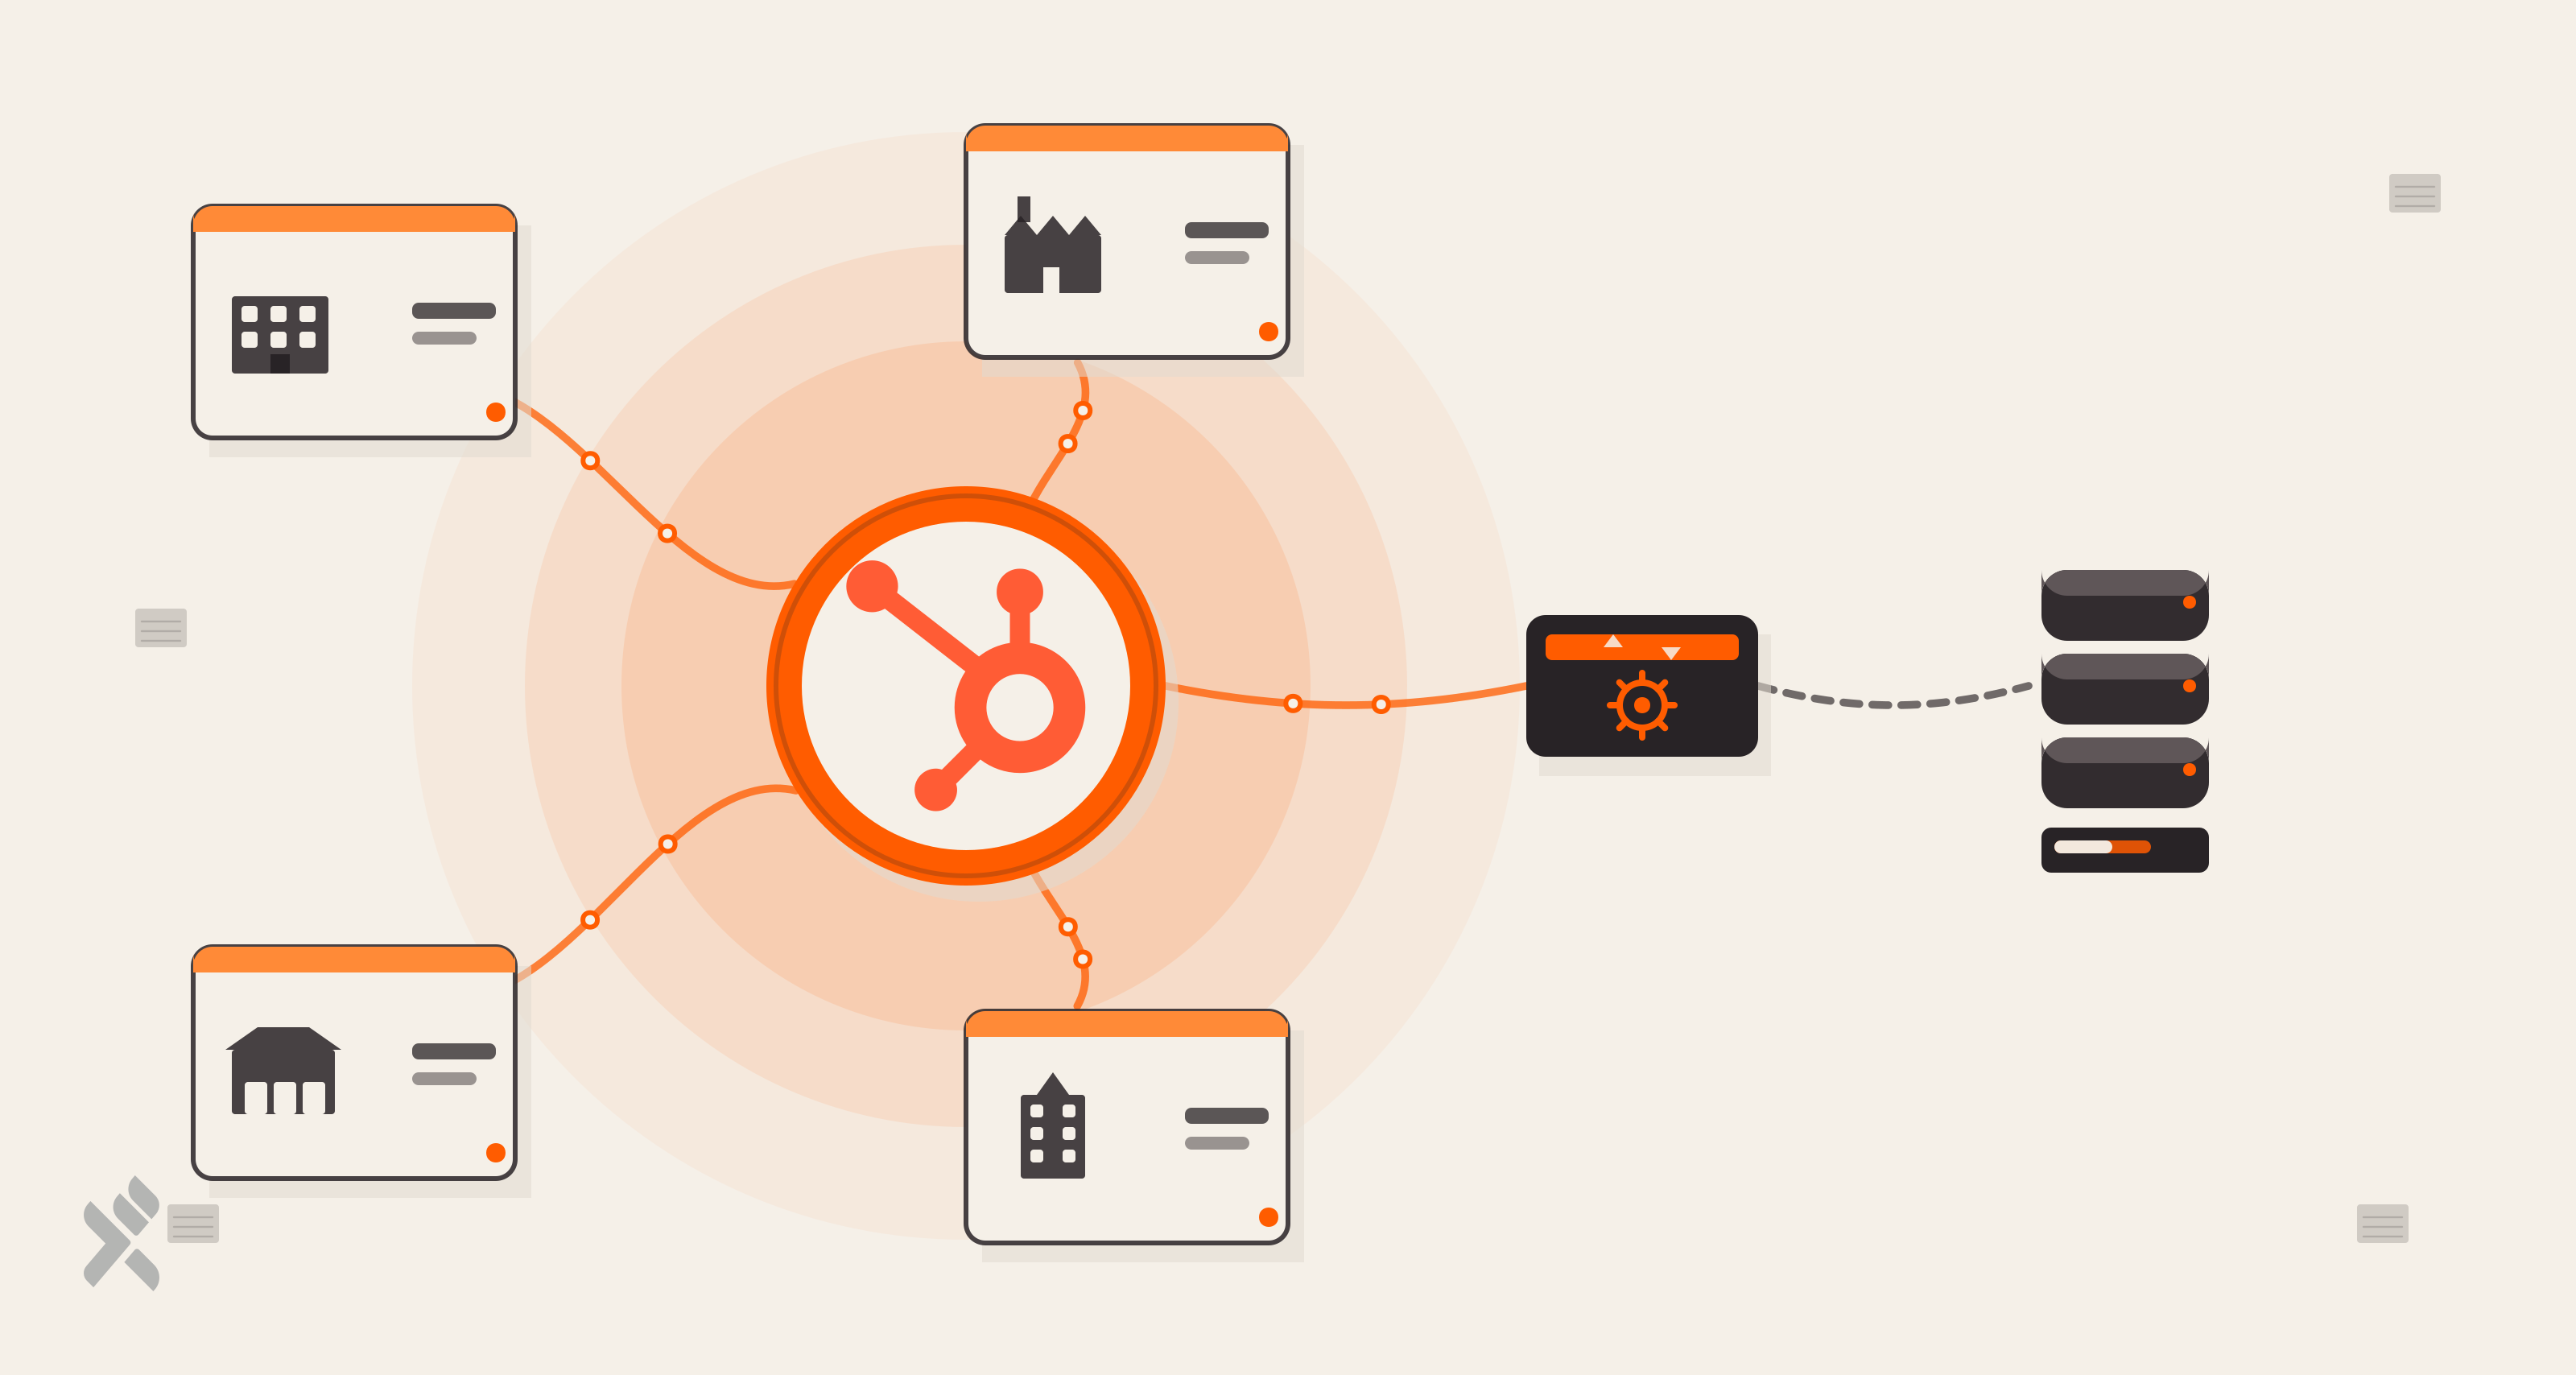
Daily ETL pipeline architecture. Each stage is independently validated; CloudWatch monitors run health; outputs fan out to CEO, department, and platform-team views.
One organizational choice mattered as much as the architecture. We ran this as a joint team rather than a handoff. Engineers from the platform side and engineers from the in-house team designed the pipeline together, built transformation logic in pairs, and co-owned validation and deployment. The reason this mattered isn't sentimental. Cost attribution depends on institutional knowledge that lives only inside the company.
-
Which department actually owns the AI tooling budget?
-
Which contract is allocated to which cost center?
-
Which vendor's "credit consumption" line item maps to which internal team?
A vendor-only build would have produced a pipeline that was technically correct and operationally useless.
What Changed
The number that matters most isn't the technical one. It's the organizational one. IT stopped being the default landing zone for shared spend. When the CFO asks where the cost grew, the answer is now "the data team's vendor renewed at a higher tier, and here's the usage curve that drove it," rather than "IT got more expensive again."
The technical numbers back it up. The pipeline processes around one million rows of service data per month. The platform expanded from five integrations at launch to over twenty today, with another wave planned for cloud infrastructure billing, database subscriptions, and AI platform usage. Monthly financial reports now flow directly to executive leadership, including the CEO. Billing anomalies that used to surface a quarter later, after a vendor escalation, are now caught the week they happen. That alone has changed how the team negotiates contracts at renewal.
The vendor negotiation shift was a second-order benefit we didn't fully anticipate. When the platform team walks into a renewal with three months of department-level consumption data, the conversation changes. Tiered pricing assumptions get challenged with evidence. Underused contracts get downsized. Overused ones get renegotiated before the surprise true-up bill arrives. The data layer paid for itself in vendor leverage well before the year was out. We've seen the same dynamic in a much smaller setting, when a team cut its video library by 70% three weeks before a Cloudflare renewal: the moment the team had real usage data, the renewal stopped being a list-price conversation.
The reliability shift was the quiet win. Validation issues used to be a monthly fire. They're now rare. That gap is the difference between dashboards leadership references in board prep and dashboards leadership ignores.
What You Can Take From This
If you're a CIO or VP of Engineering looking at the same problem, here is the one transferable point. Cloud financial visibility is not a dashboard problem. It's a data engineering problem dressed up as a dashboard problem. The reason most FinOps initiatives stall in enterprises with complex tool stacks is that nobody owns the normalization layer. You can pay any vendor to render charts. Almost none of them will fix the fact that your twenty platforms emit billing data in twenty different shapes.
Build the pipeline first. Decide on a schema that holds across event-based, license-based, and credit-based billing. Validate at every stage. Then attach the dashboards. Attribution becomes a downstream question once the data underneath is honest, and the moment attribution becomes honest, the conversation about cloud spend stops being defensive.
A second pattern, less obvious: start with five integrations, not twenty. Pick the platforms that account for the largest share of unattributed spend, prove the schema and the validation framework on those, and only then expand. The temptation is to do a big-bang ingest of the whole stack. That route is where these initiatives die. Iterative scope is how you get the platform that scaled from five services to over twenty, instead of the platform that never shipped at all.
If you want to go deeper on the engineering patterns underneath this work, our data engineering posts cover related architectures, validation strategies, and pipeline decisions across other engagements.
If you're navigating cloud spend attribution at enterprise scale, we'd be glad to think through it with you. We've worked on enough of these to know which parts are likely to bite next.

Prateek Jain, Director of Digital Solutions & AI Strategy
Offline, if he's not spending time with his daughter he's either on the field playing cricket or in a chair with a good book.


Leave us a comment